The UC Office of the President has this statfinder app running at statfinder.ucop.edu and it lets you generate tables with statistics about student admissions at their schools.
Big whoop. The thing is, when the numbers get real small, their program merges categories to ensure that student privacy is protected. Also, they won’t give access to the raw database nor will they let you select more than 3 categories to compare at once. So data mining this is a bit difficult.
- Obviously, they don’t want anybody to create something remotely automated from this data. There is no API, the numbers are probably fuzzed, the raw data is totally unavailable, and the stupid categories merge themselves.
- American Indians are always lumped into a single category, no matter what it is. I wonder if they even split the girls from the boys. Ha!
- If you’re just one person looking for better insight into your UC chances, you can of course bring up only the tables that are pertinent to you. One is easy, automated is hard. Sounds a bit like P/NP.
- There is a lot that you can extrapolate just from the numbers they give you. You can use a sort of logistic regression or an exponential curve. Those would probably be the best two models for this.
- Even if you modeled each of the statistics (SAT, GPA, high school API, ethnicity), you would need to determine weights for each of these if you wanted to make a chances calculator.
- Does a 4.0 from a really crappy school mean that low API scores boost your chances? Bad schools tend to have lower statistics though. It’s more about how unexpectedly high a GPA is based on environment.
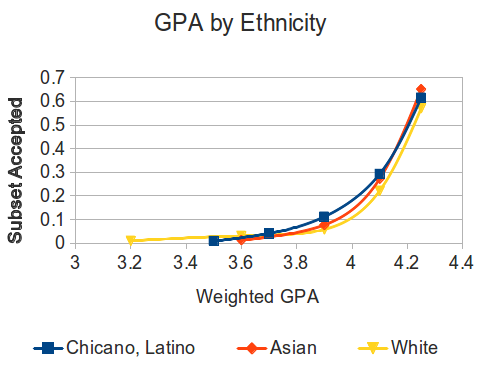
- The ethnic advantage is so clear.
- “Export to XLS” actually uploads the HTML-encoded content, changes the file extension, and serves it back to you. Good fucking job, programmers.
- Based on a report they published, it is a C# application running on 2 load-balancing web frontend machines with 2 dedicated database machines. They all run Windows (oh brother).
- Such a database would be infrequently written to, but frequently read. Memcached would be a great boon here, but it’s not like they’re out to get 73GB of RAM.
- They use a local load balancer. All four servers are likely on their own private subnet, and getting the raw data wouldn’t be likely.
- They claim to protect privacy “by aggregation”. Let’s see how that holds out.
I will update this page as I continue this exploration.
Update 1: I have plotted a couple of data points and find that SAT and GPA scores can be modeled with an exponential function fairly well. Each ethnicity of a specific school has only slight variations in the model coefficients.

It’s likely that many of the statistics about a specific student will yield statistics in the same approximate range. This is simply the nature of correlated statistics. A carefully weighted average of these probabilities should be a pretty good estimator of the actual admission probability.
Update 2: If certain colleges are supposedly more difficult to get in to, or have strong gender bias (CoE), how do I compensate for that? I will certainly need to pull data from outside sources to assist.
Update 3: The GPA curves fit exponential curves very well. The thing is, at extremes you get unrealistic values like probabilities greater than 1. To curb this, the maximum value is set at an unattainable high and bounds are placed near the ends. Typically, a value gets so close to 100% or 0% that any significant digits procured by regression are unimportant.
I have also implemented models to adjust for international status, ethnicity, field of study, high school state-wide API rank. The weighted, capped GPA that UC schools use will reflect UC-approved honors courses as a measure of rigor.
In truth, a large part of interpreting the results is up to the user. If they feel that their AP courseload is too easy or their IB programme is very challenging, then they should reflect that in their interpretation. This is turning out to a pretty good estimator of admission, even though it is only a historical comparison.
Update 4: I have completed a proof-of-concept design for the calculator under UC Berkeley. I am now collecting data for other schools. Merced is difficult, as it is nearly impossible to be rejected. Additionally, I must implement some check for the 3.00 GPA eligibility requirement for UC’s. I did not realize that I would have to go so low for some schools.
The finished product is up at rogerhub.com/uc-undergraduate-admissions-calculator.